
Digital Publishing · Analytics & data visualization
Publisher Dashboard
Helping bloggers track performance and manage their site’s ads and appearance.
About Mediavine
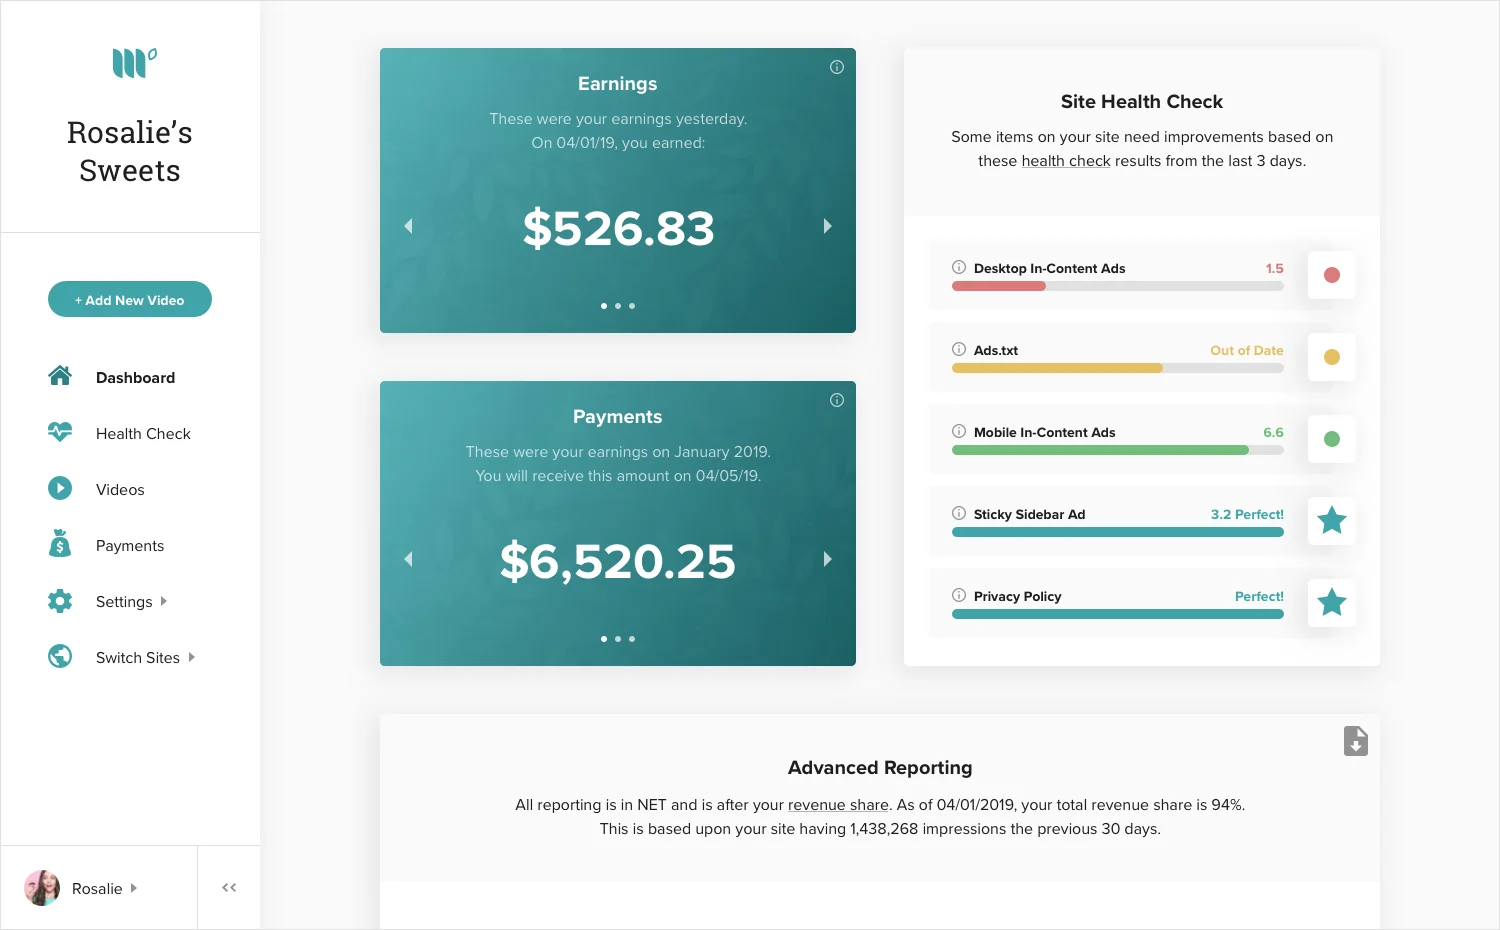
Mediavine is an independent ad technology company that helps bloggers earn revenue through advertising. Its dashboard gives bloggers a place to check earnings, understand ad performance, and manage ad settings and their site’s appearance. These are essentially small business owners who need clear answers without becoming analytics experts.
A lot of data, without the confusion
Bloggers needed to understand their earnings, check site health, and find the right settings. There was so much data, and it needed a cleaner structure. When information or controls were hard to find, even a routine question could turn into a customer service request.
As the sole designer at the time, I redesigned the hierarchy, navigation, reporting, and health checks. The goal was to help bloggers handle more on their own and reduce avoidable contact with our support team.
Make the next step easy to find
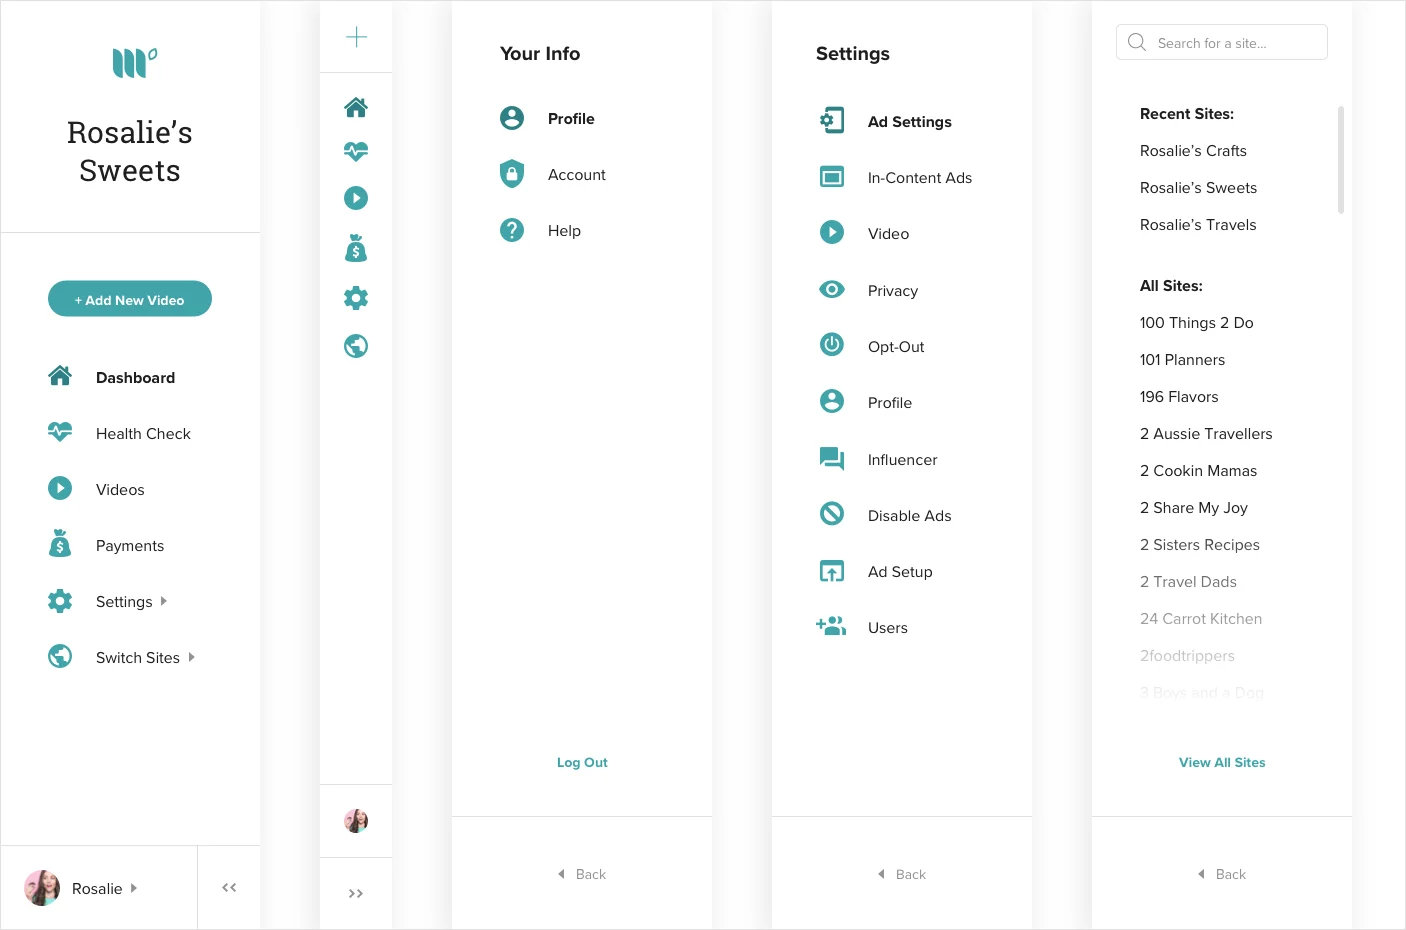
I grouped reporting, ad settings, and site controls into a clearer navigation structure. Bloggers could follow predictable categories, and support could point to a specific destination instead of explaining a long sequence of clicks. I also designed for bloggers managing many sites, showing how navigation and site switching would hold up with much more data.
Give the data a clear hierarchy
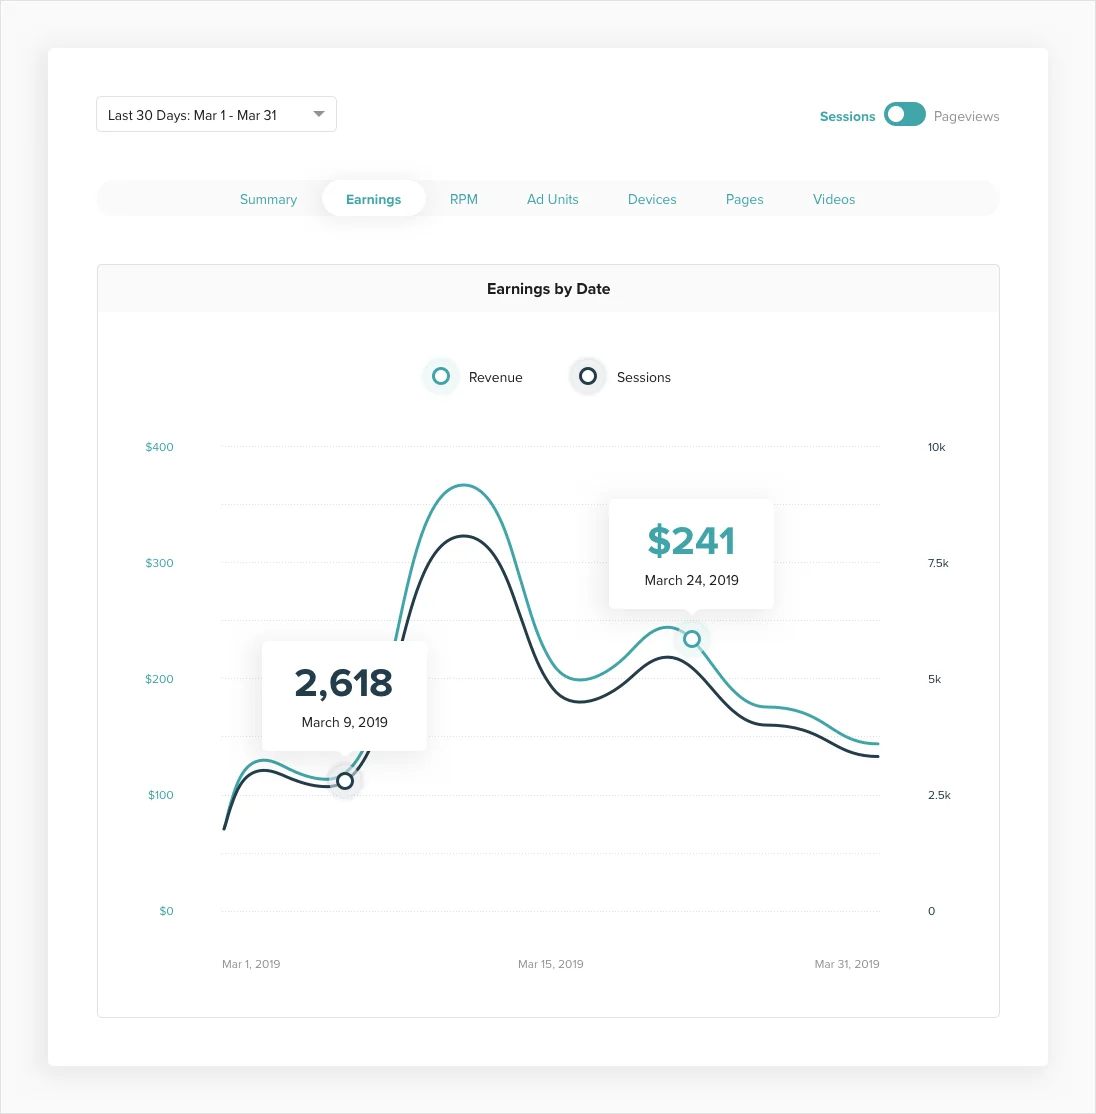
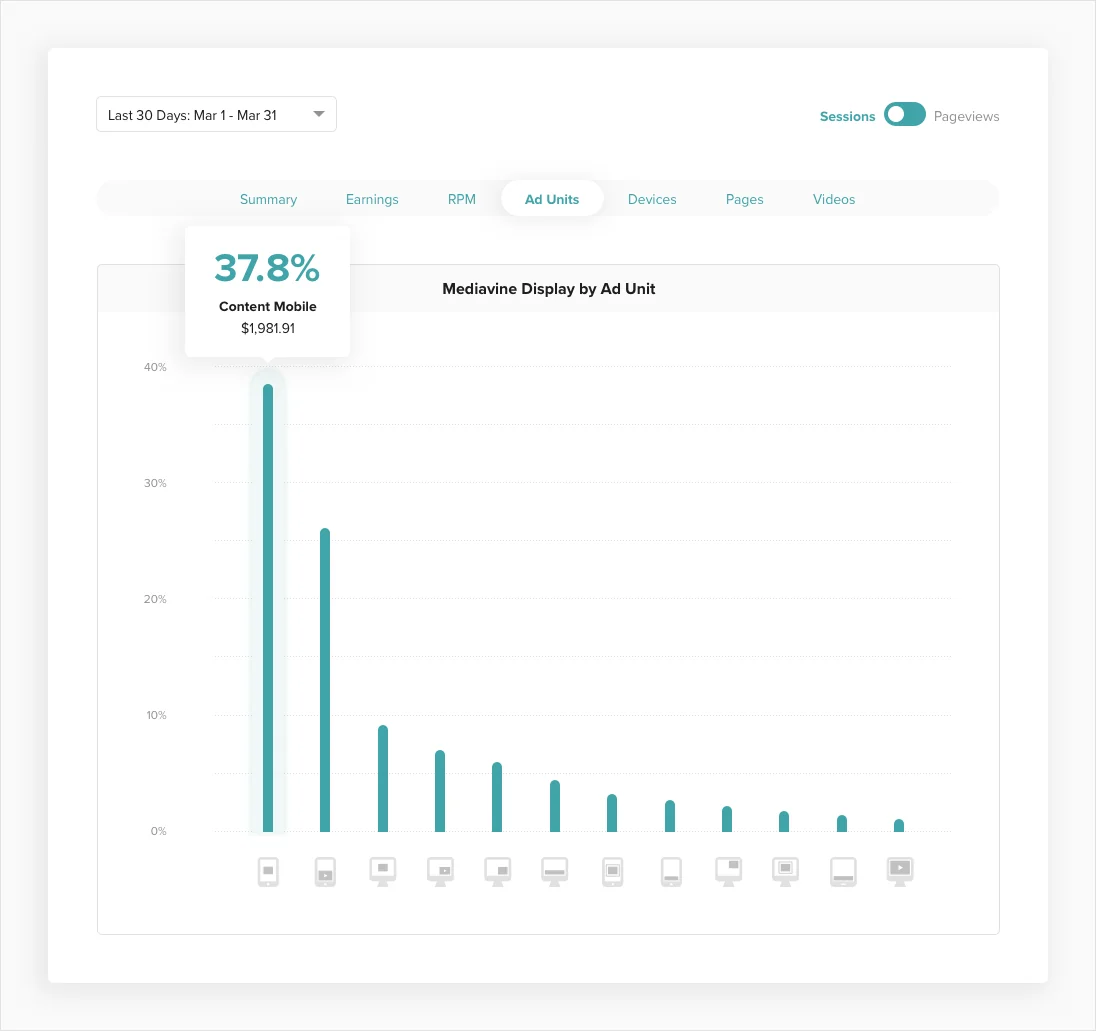
Totals and trends come first, with filters and more detailed comparisons close by. Consistent charts help bloggers recognize changes in earnings and understand how different ad formats contribute. And of course, it has to look attractive.
Turn site health into something useful
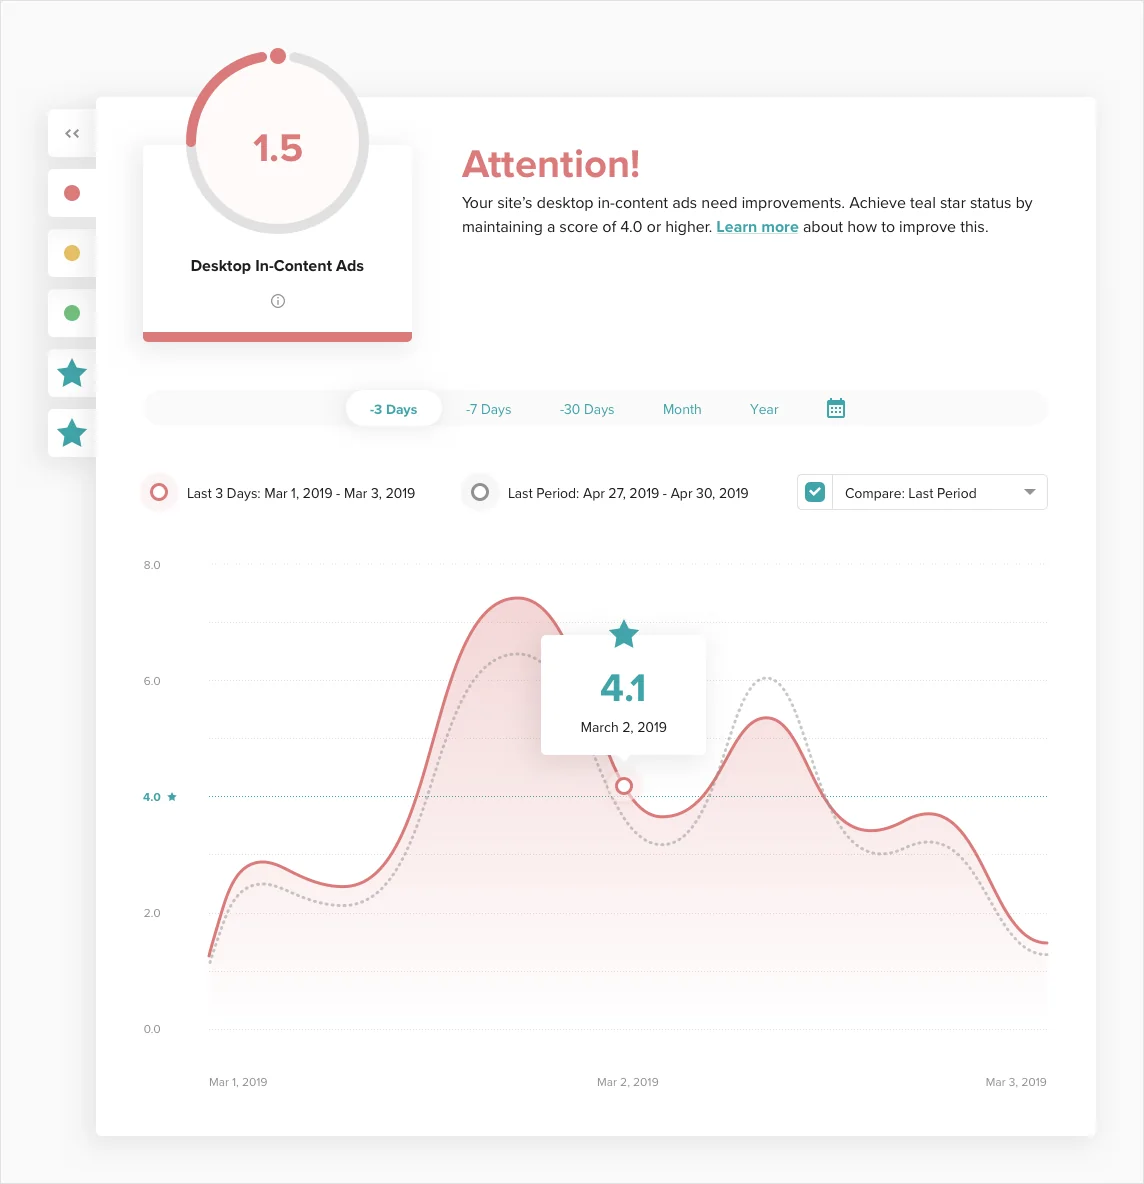
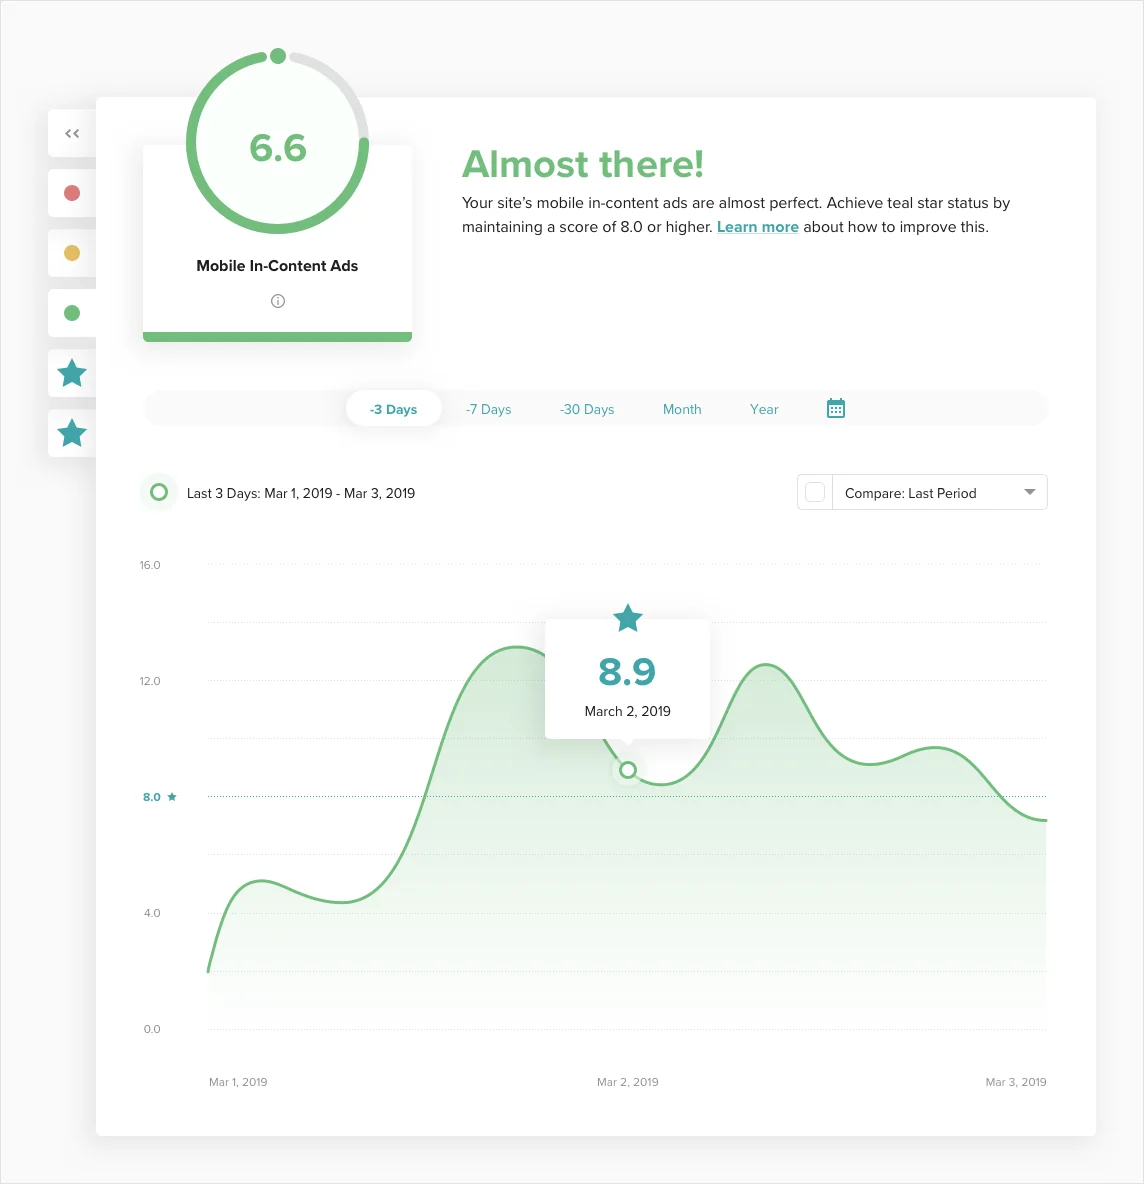
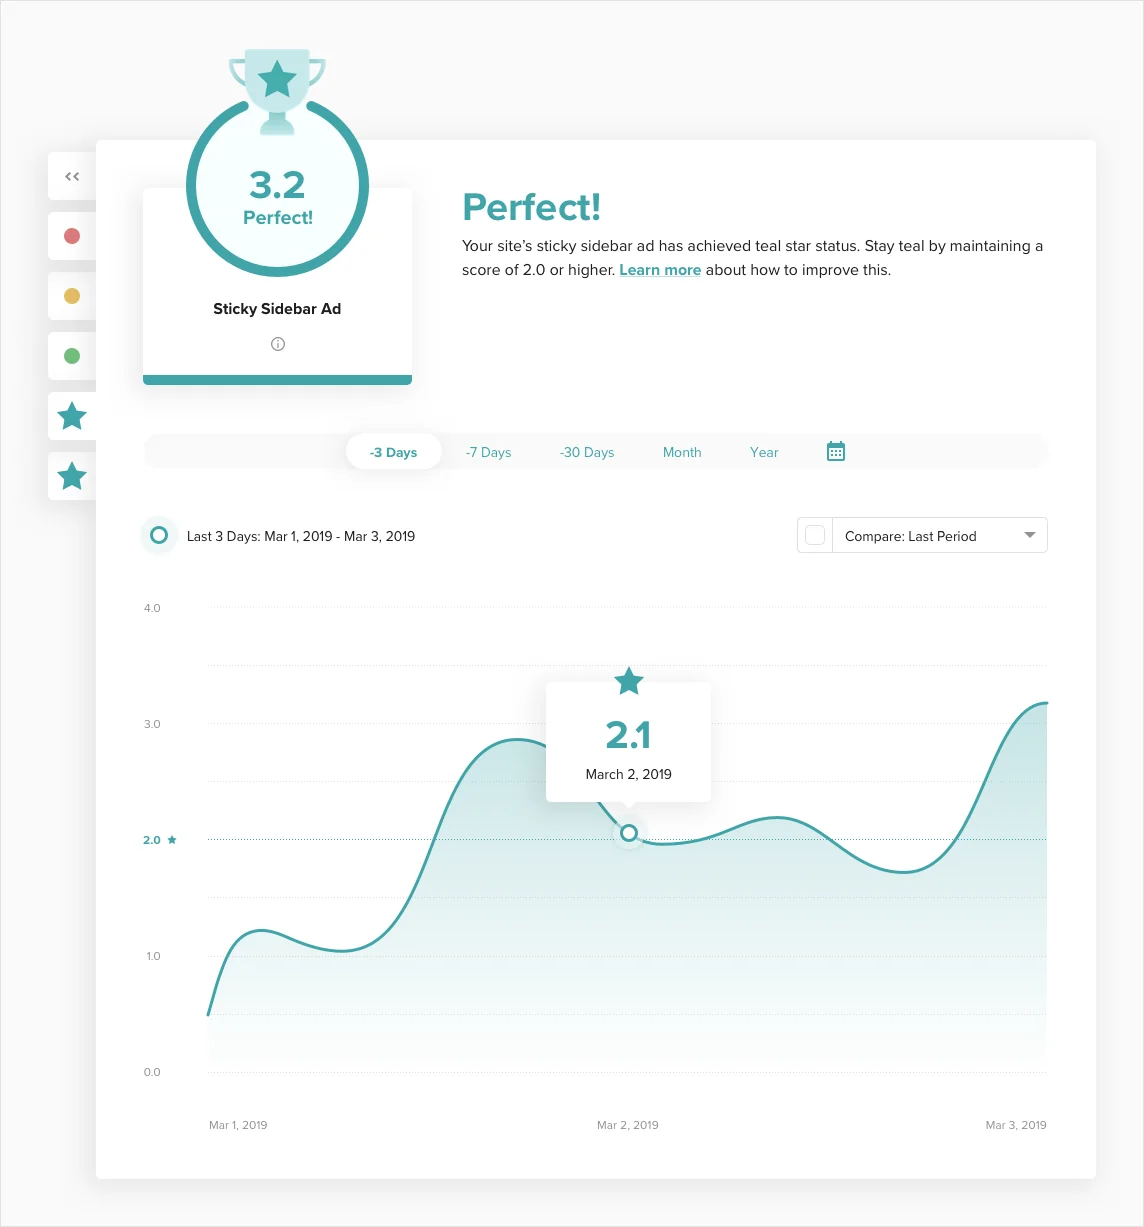
A score alone doesn’t explain what to do. I paired it with a plain language status, supporting detail, and a trend so bloggers could understand what needed attention before asking customer service. Encouraging colors and icons make progress easy to recognize, and a trophy adds a small sense of achievement when their site is doing well.
Keep reporting controls consistent
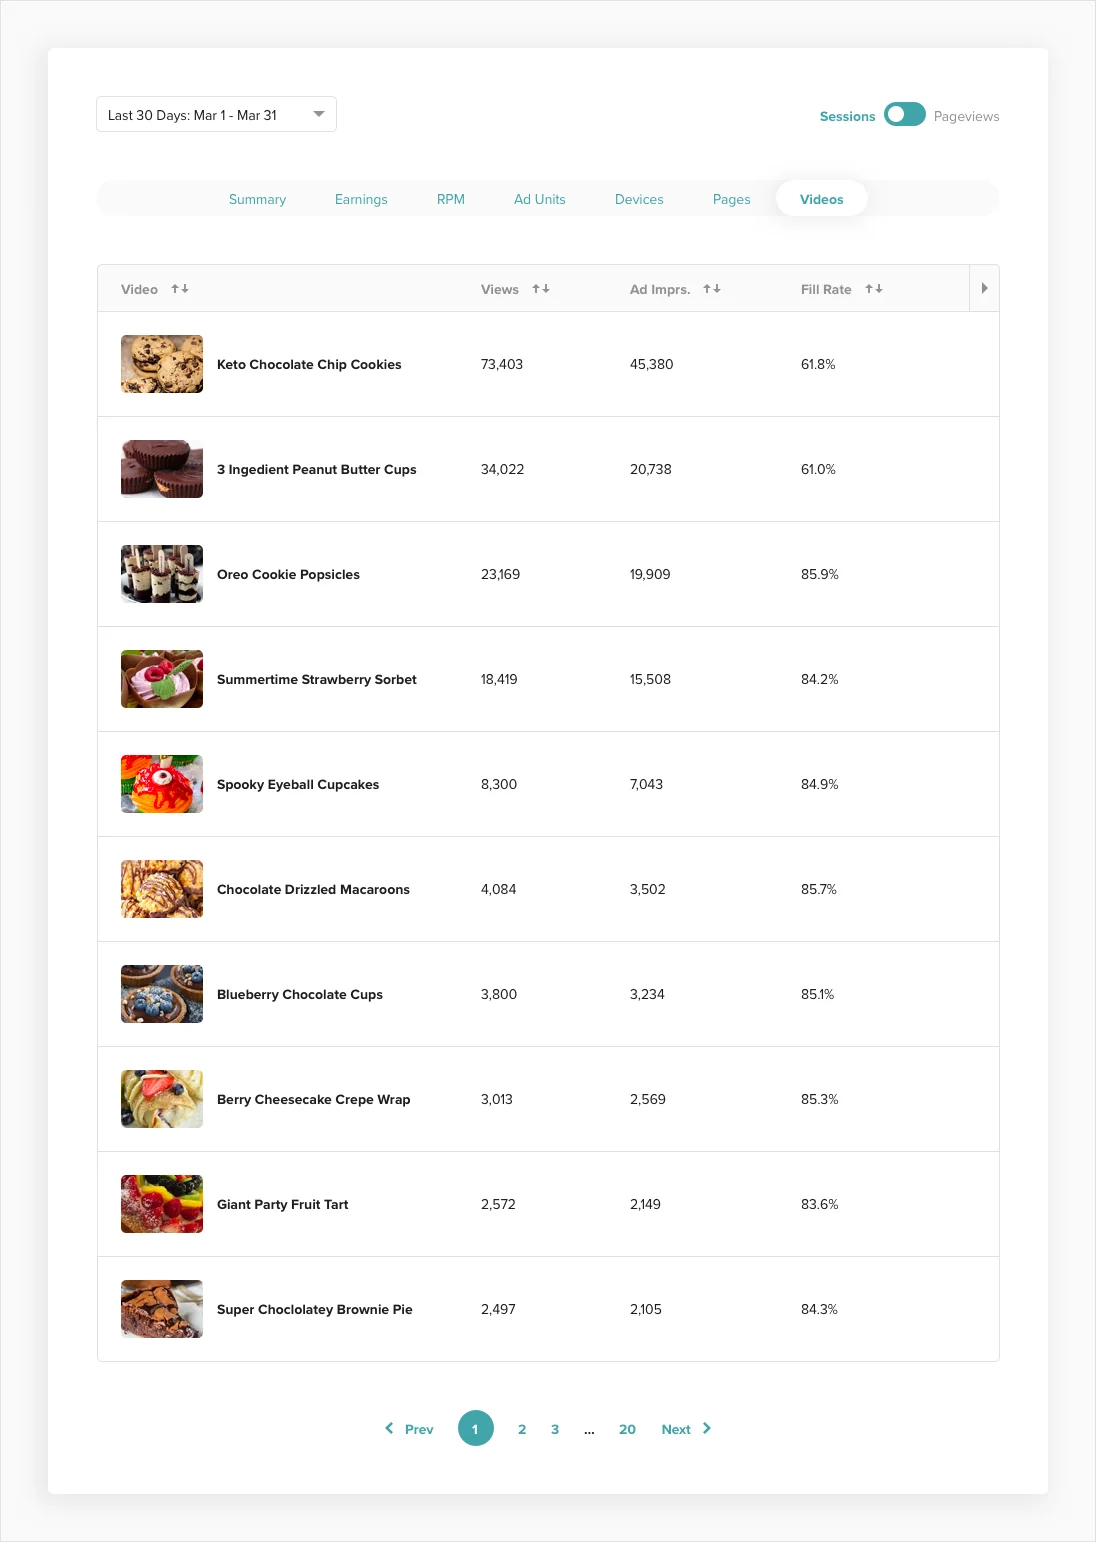
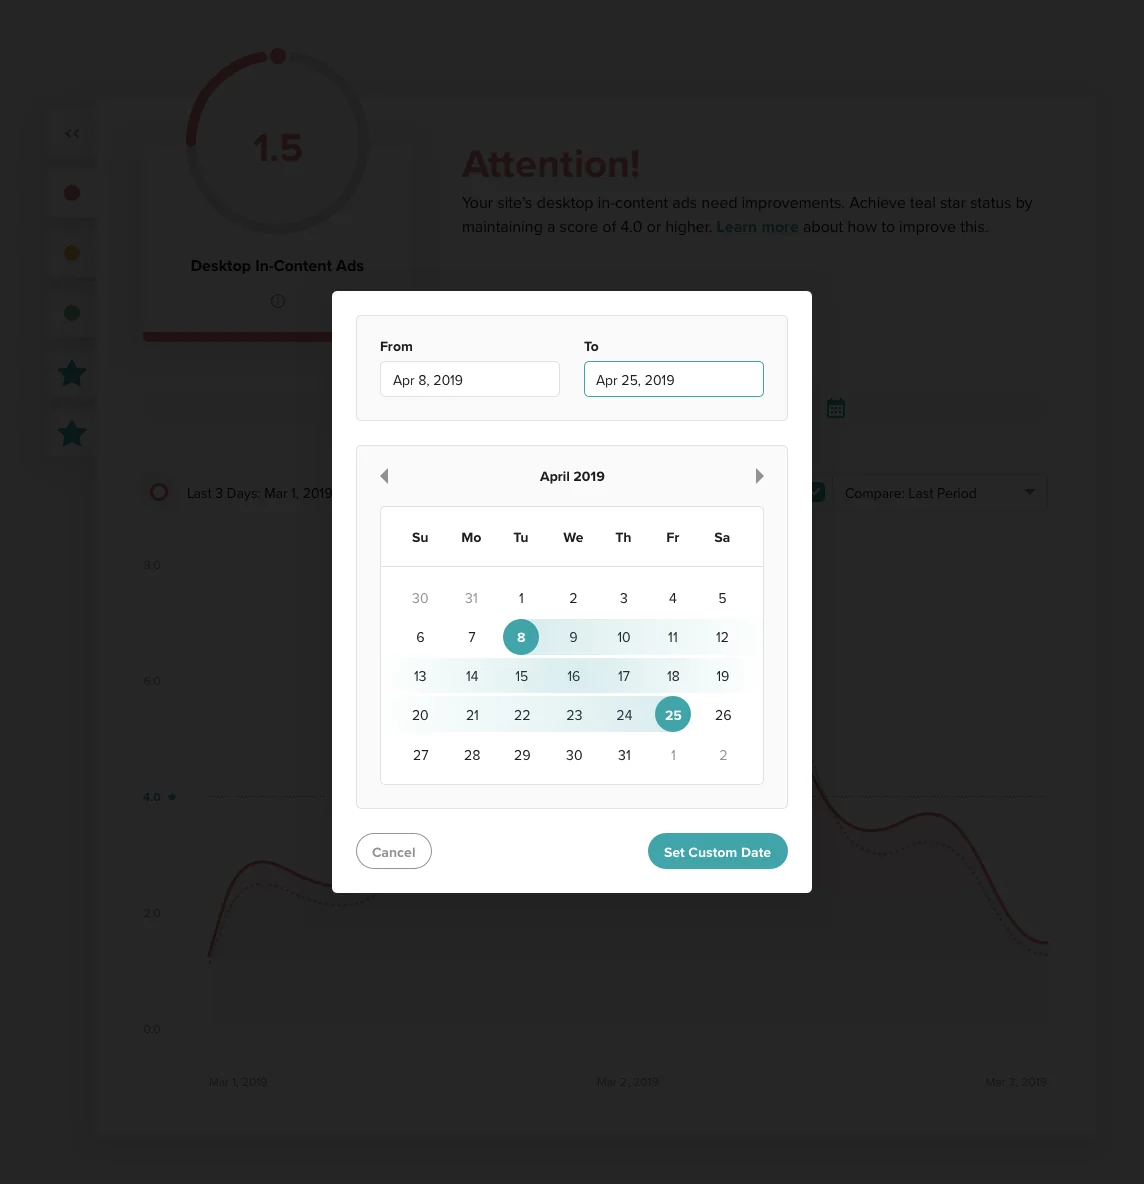
Post reports help bloggers investigate individual content. A shared date picker, table hierarchy, and reporting controls make it easier to compare results without relearning each page.
Design targets
For bloggers, time spent hunting for a setting is time taken away from writing, photographing, and running their business. I wanted the dashboard to give them answers they could find and act on with confidence, without waiting for a support reply. These targets focus on that everyday experience: less time searching, fewer interruptions, and more room to focus on the work they care about.

More answers within the dashboard
The redesign gives bloggers a clearer way to understand performance, manage settings, and check site health. Organizing the data and keeping controls consistent supports more independent use, with fewer reasons to reach out for help.